




By Mike Chen, Production Director | 12+ Years in Rubber Manufacturing | LinkedIn
Key Takeaways
- A single XCJ-G600 barrel cycles a 15 kg batch every 20–40 seconds — more than 1,300 data-rich cycles per 8-hour shift are already available for IoT capture.
- Cryogenic deflashing units run at temperatures down to −150 °C with roller speeds of 20–70 RPM, and logging both variables directly exposes nitrogen waste and insulation drift.
- Because connected machines reveal process drift early, predictive maintenance typically converts unplanned stoppages into scheduled interventions of under 30 minutes (typical values from our customer projects).
- Retrofitting beats replacing: inverter-driven equipment such as the 7.5 kW XCJ-G600 can usually be connected with sensors and an edge gateway instead of a new purchase.
Most manufacturers we work with already own deflashing equipment that is intelligent at the machine level and completely silent at the factory level. The controller knows the roller speed; the operator knows the batch weight; the quality team knows the rejection rate — but nobody connects the three. That disconnection is exactly what AI and IoT projects are designed to fix.
This article explains what integration genuinely means in a deflashing context, which data points are worth connecting first, and a phased roadmap that works for small and mid-size rubber plants rather than hyperscale smart factories.
What Do AI and IoT Actually Mean in a Deflashing Context?
The Internet of Things (IoT) is the practice of connecting industrial equipment to a network so its operating data can be collected, stored, and reviewed; artificial intelligence (AI) is the software layer that finds patterns in that data and recommends or executes decisions. In deflashing, the two work as a pair: IoT supplies the raw signal, and AI turns the signal into action — slowing a roller, flagging a worn belt, or quarantining a suspect batch before it ships.
It helps to think of a deflashing machine as a data source first and a deburring tool second. Every mechanical deflashing cycle and every cryogenic run below −120 °C produces a traceable fingerprint of speed, time, temperature, and load. Once those fingerprints are stored, questions that used to require a process engineer standing at the barrel for a full shift — “when did cycle times start creeping up?” — become a ten-second dashboard query.
Which Deflashing Data Points Are Worth Connecting First?
Start with the four variables that already decide deflashing quality: cycle time, roller speed, process temperature, and batch load. They exist on every machine, they change when something goes wrong, and they map directly onto product outcomes. The table below pairs each variable with real equipment values and the optimization it unlocks.
| Data Point | Typical Equipment Value | What AI Does With It |
|---|---|---|
| Cycle time | 20–40 s per batch (XCJ-G600, 15 kg load) | Detects drift that signals blade wear or drive fatigue before quality drops |
| Roller speed | 20–70 RPM (cryogenic deflashing unit) | Correlates speed settings with surface finish to recommend best RPM per compound |
| Process temperature | Down to −150 °C max rating | Flags insulation losses and nitrogen overuse visible only in logged cooling curves |
| Batch load | 80 L roller, roughly 15–20 kg | Identifies under-loading that wastes cycles and over-loading that raises reject rates |
Equipment values sourced from the XCJ-G600 product page and the liquid nitrogen cryogenic deflashing machine specifications.
Because cryogenic embrittlement is a race between temperature and time, logged cooling curves are the single most valuable dataset on a cryogenic line. A run that reaches target embrittlement in 5 minutes instead of 8 has saved 37% of its cycle — a saving that is invisible on a stopwatch but obvious in the data.
How Does Predictive Maintenance Change Deflashing Economics?
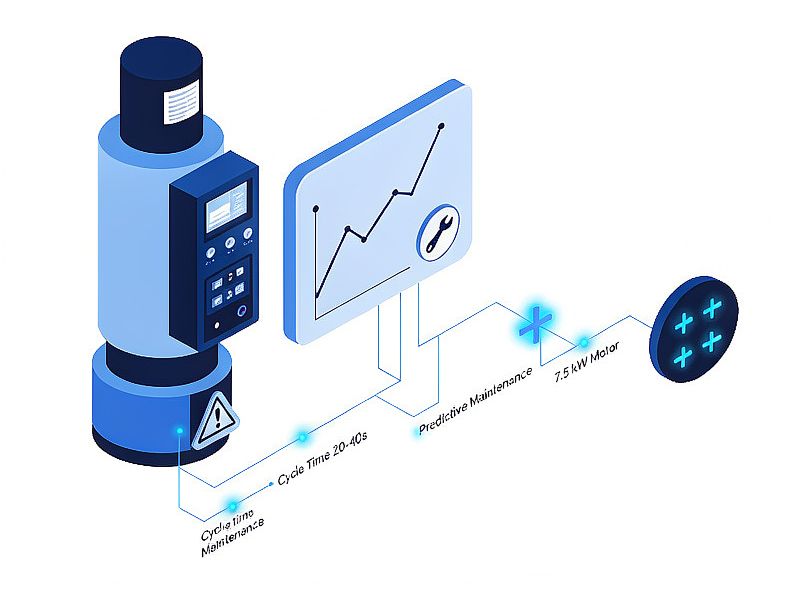
Predictive maintenance uses trend data — rising cycle times, motor current fluctuations, temperature instability — to schedule service before a component fails, instead of after. The economic difference is stark: a failed drive motor mid-shift stops the line, scrambles the schedule, and can scrap a full in-process batch, while a planned swap identified two weeks early happens between shifts.
In our experience supporting deflashing lines at customer plants, connected monitoring typically surfaces three to five actionable process drifts per quarter on a single machine — most commonly gradual cycle-time extension and inconsistent cryogenic cooldown — and each one is fixable in a scheduled window under 30 minutes (typical values from our customer projects; exact figures vary with compound mix and shift pattern). Because the 7.5 kW inverter on a machine like the XCJ-G600 already reports motor load digitally, the entry cost for this level of monitoring is a gateway and configuration, not new hardware.
There is a compliance angle too. Plants certified to ISO 9001 are asked to demonstrate continual improvement; a data trail of machine parameters per batch is one of the cleanest pieces of evidence an auditor will accept.
Where Does Machine Vision Fit Into the Quality Loop?
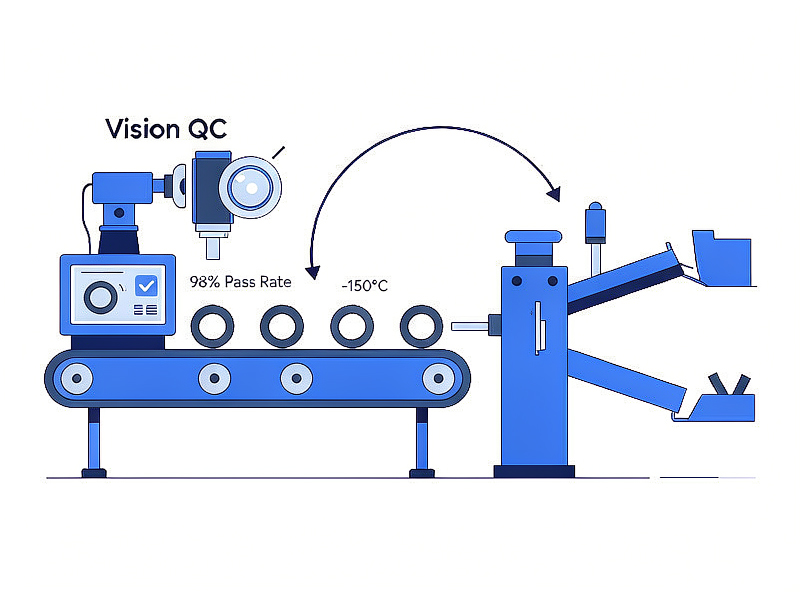
Machine vision closes the loop that sensor data alone leaves open: cameras inspect deflashed parts, and the AI layer traces every rejected part back to the exact cycle, speed, and temperature that produced it. This turns quality control from a rear-view activity into a steering input.
The practical chain looks like this: parts leave the deflashing barrel, pass through a vision check that flags residual flash, and clean parts continue to a rubber separator machine that sorts good product from trim waste. When the vision system logs a rejection cluster, the AI compares timestamps with barrel data and answers the question that matters: was this a bad compound, a wrong roller speed, or a batch that was 2 kg over spec?
Cryogenic lines gain the most from this pairing. Cryogenic deflashing achieves finished-product pass rates above 98% when parameters are stable, so even a small logged deviation — a cooling curve running 10 °C warmer than baseline — is worth catching before it costs three points of yield.
What Does a Realistic Integration Roadmap Look Like?
The workable approach for most rubber plants is three phases: connect, analyze, then optimize — in that order, on one machine before the whole line. Trying to automate decisions before data exists is the most common failure mode we see in Industry 4.0 projects.
- Connect one machine and define the baseline. Install an edge gateway on a single deflashing unit — the newest, most inverter-driven one — and log cycle time, speed, temperature, and load for 60 days without changing anything, so “normal” is measured rather than assumed.
- Analyze against quality outcomes. Merge the machine data with rejection records from inspection, and let the AI layer (or a good spreadsheet, honestly) search for correlations between parameter drift and quality events.
- Optimize with closed-loop alerts. Set alert thresholds from the baseline, route them to operators’ phones or the plant dashboard, and only then consider automatic parameter correction — the step that requires the most governance and the least urgency.
Start With the Machine That Hurts Most
Do not begin with your newest machine. Begin with the one that causes the most overtime, the most rework, or the most awkward customer conversations — that is where connected data pays for itself fastest.
What Are the Honest Limitations?
AI and IoT will not fix an unstable process, a worn barrel, or a badly specified mold — they will merely report those problems faster and more precisely. Integration amplifies good process control; it does not substitute for it.
Two further cautions from our project experience. First, small compound runs generate thin data: an AI model trained on 300 cycles of one O-ring size will not transfer cleanly to a family of 40 short-run parts, so expectations must be set per product mix. Second, connectivity has a security surface — guidance such as the manufacturing cybersecurity resources published by NIST is worth reading before a gateway goes live. Because a deflashing cell is rarely internet-facing by design, a properly segmented factory network keeps the added risk modest, but “modest” is not “zero” and should be budgeted for.
Conclusion: Connect the Data You Already Have
Rubber deflashing is unusually well suited to AI and IoT integration, for one simple reason: the machines already run on precisely controlled, quantifiable variables. A 15 kg batch, a 20–40 second cycle, a −150 °C ceiling, a 20–70 RPM roller range — these are data points waiting to be collected, and every one of them carries quality information.
If you are planning the next equipment investment, choose machines whose controllers expose that data cleanly. Explore the full rubber deflashing machine range from Xiamen Xingchangjia, or send us your part drawings and target output — our engineering team will propose a deflashing configuration with connectivity options matched to your plant’s automation level.
Related Equipment Information
• XCJ-G600 super model rubber deflashing machine — 600 mm barrel, 7.5 kW inverter drive, 20–40 s cycles.
• Liquid nitrogen cryogenic deflashing machine — −150 °C rating, 20–70 RPM roller, sub-8-minute cycles.
• Rubber separator machine — automated sorting of deflashed parts and trim waste for closed-loop QC.
• Rubber deflashing machine category — full product lineup with specifications.
Frequently Asked Questions: AI and IoT in Rubber Deflashing
Xiamen Xingchangjia Non-Standard Automation Equipment Co., Ltd.
Floor1, Building 13, Huli Industrial Park, Meixidao, Tongan, Xiamen China
Email: info@xcjrubber.com | Website: www.xmxcjrubber.com
Published: September 2026 | Last verified: September 2026
Post time: Sep-08-2026